Your website might look perfect when you test it yourself. But that doesn’t mean visitors experience it the same way.
Maybe people never reach your contact button. Maybe they’re repeatedly clicking something that isn’t interactive. Or perhaps they’re abandoning a service page before finding the information they need.
A Microsoft Clarity website analysis can help you investigate these problems using actual visitor interactions.
Here’s a practical five-step process you can apply without being a developer.
Start With One Important Page
Before opening dozens of reports, choose one page that matters to your business.
Good starting points include:
- Your main service page.
- A Google Ads landing page.
- Your contact page.
- A high-traffic product page.
Make sure Microsoft Clarity is installed and collecting data.
Open your Clarity project and select the Heatmaps section.
Rather than analysing your entire website, focus on one URL. This makes it easier to understand what visitors are doing and identify improvements worth testing.
Step 1: Open Your Heatmap
Inside Heatmaps, select your target page or search for its URL.
Microsoft Clarity provides different visualisations, including:
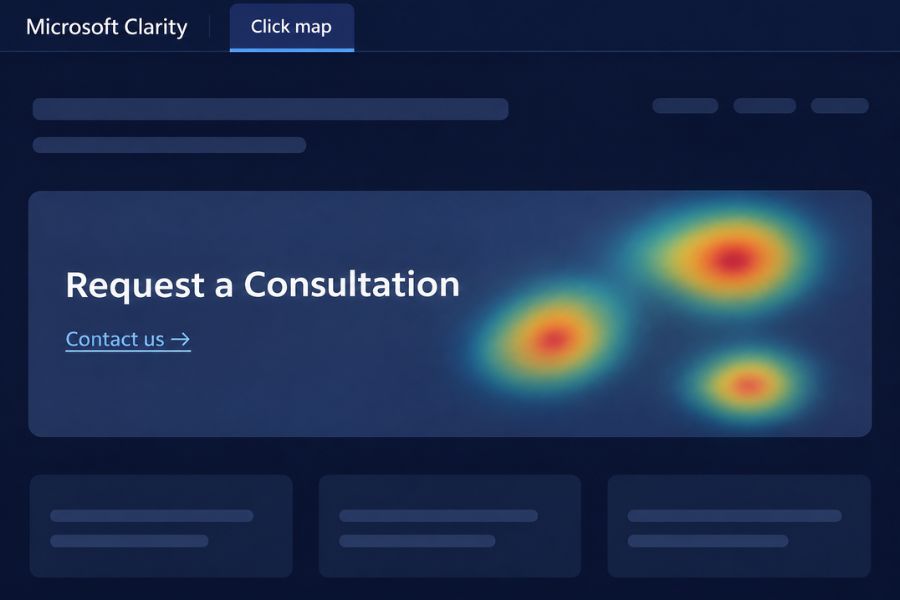
Click maps: Show where visitors click or tap.
Scroll maps: Show how far visitors scroll down the page.
Start with the scroll map.
Suppose your main contact button is positioned near the bottom of a long service page.
If only a small proportion of visitors reach that section, many people may never encounter your primary call to action.
This doesn’t automatically mean the button needs to move. It tells you where to investigate next.
Compare desktop and mobile behaviour, since visitors may experience the same page differently depending on their device.
Step 2: Check Whether Visitors Notice Your CTA
Switch to the click map and examine your most important buttons and links.
Ask yourself:
- Are visitors interacting with the primary CTA?
- Are they clicking secondary elements instead?
- Are people clicking images or text that aren’t interactive?
- Do mobile visitors behave differently?
For example, imagine a website displaying a large card with the text “Request a Consultation”.
The card looks clickable, but only a small text link inside it actually works.
If visitors repeatedly click the surrounding area, you may have discovered a usability problem.
This is particularly relevant for websites designed to generate enquiries, where small interaction issues can interrupt the customer journey.
Remember that heatmaps show patterns, but they cannot explain every visitor’s motivation.
Step 3: Watch Relevant Session Recordings
Next, navigate to the Recordings section.
Use the available filters to focus on sessions involving your chosen page.
If you’re investigating mobile usability, filter by mobile devices. If you’re examining a particular landing page, use the relevant page or URL filter.
Watch a selection of recordings and look for:
- Visitors struggling to navigate.
- Repeated attempts to click an element.
- People scrolling up and down searching for information.
- Forms that appear difficult to complete.
- Visitors leaving after encountering an obstacle.
Try to identify recurring behaviour rather than drawing conclusions from one unusual session.
For example, if several visitors reach your pricing section and repeatedly return to an earlier section, the page might need clearer explanations.
Our article on why premium websites sometimes struggle with conversions explores how presentation and usability can influence commercial performance.
Step 4: Investigate Dead Clicks and Rage Clicks
Microsoft Clarity also identifies interaction patterns that may indicate frustration.
Two useful signals are:
Dead clicks: Clicks that don’t produce a detectable response.
Rage clicks: Multiple rapid clicks within a small area.
You can investigate these using Clarity’s relevant filters, insights and click map options.
Imagine someone repeatedly clicking a button labelled “View Pricing”, but nothing happens.
That deserves immediate attention.
However, not every rage click means something is broken, and not every dead click represents a serious usability issue.
Check the relevant recording and test the element yourself before deciding what needs fixing.
Step 5: Make One Improvement and Measure Again
After reviewing the evidence, choose one clear problem to address.
For example:
| What you noticed | What to investigate |
| Visitors rarely reach the CTA | Test moving it higher |
| Repeated clicks on an image | Make it interactive if appropriate |
| Mobile users struggle with navigation | Review menu usability |
| Visitors abandon a form | Test fields and validation |
| Important content receives little attention | Improve layout and hierarchy |
Make a focused change and document the date.
Then allow enough additional visitor data to accumulate before comparing behaviour.
You can combine Clarity insights with GA4 events and enquiry data to understand whether the change is associated with better business outcomes.
Avoid assuming that a visible improvement in heatmaps automatically produces more conversions.
Common Mistakes to Avoid
Watching Recordings Without a Specific Question
Randomly watching sessions can consume hours without producing useful conclusions. Start with a page and a problem you want to investigate.
Treating Every Unusual Interaction as a Problem
One frustrated visitor doesn’t necessarily represent your wider audience. Look for repeated patterns and verify suspected issues.
Ignoring Privacy Settings
Before collecting visitor behaviour, review Clarity’s masking options, consent configuration and applicable privacy obligations. Make sure sensitive information is appropriately protected.
FAQ
Is Microsoft Clarity free?
Yes. Microsoft provides Clarity as a free behavioural analytics tool for websites.
Can Microsoft Clarity show why visitors leave?
It can reveal behaviour leading up to an exit, but it cannot establish a visitor’s exact motivation. Use recordings and heatmaps as evidence for further investigation.
Does Microsoft Clarity replace Google Analytics?
No. They serve complementary purposes. GA4 measures events, traffic and outcomes, while Clarity helps you investigate how people interact with your website.
What to Do Next
Open Microsoft Clarity, choose your most important service or landing page and review its heatmap alongside a few relevant session recordings.
Write down one recurring problem and decide what you could improve.
If you want to turn those findings into a more effective website, our team can help you prioritise practical changes that support your business goals.